Lions and friends…
I want to share with you this piece of work by FHIX28, I have his permission, regarding Bull Runs and The MMRI.
(Click on each chart to enlarge).
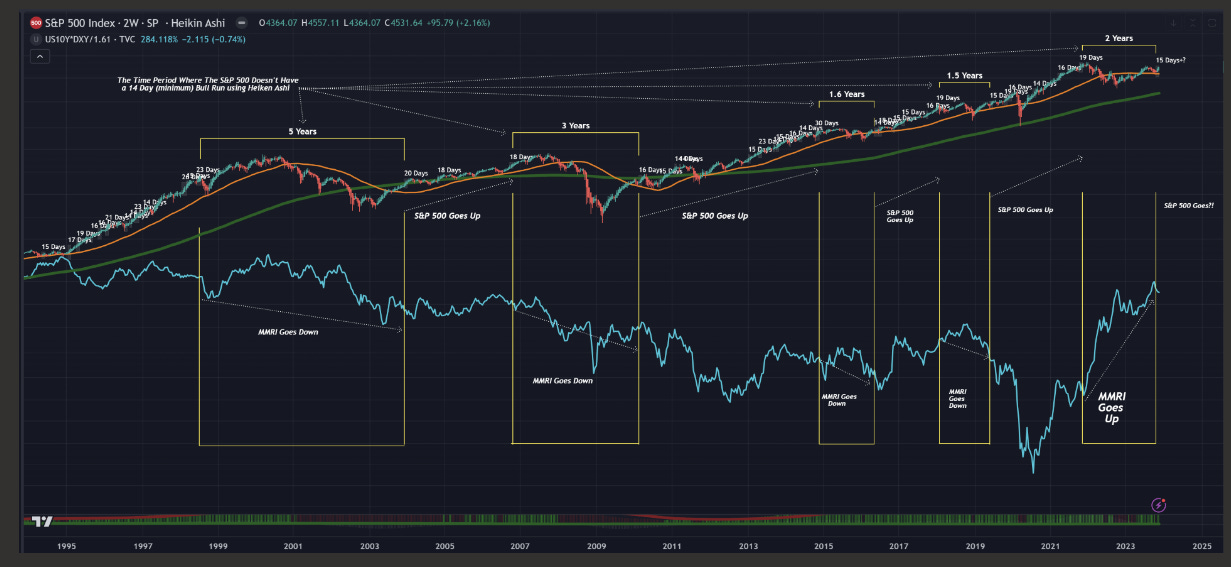
These areas highlight 1994 - Present.
The areas labeled 14 days, 15 days, 16 days...etc, are areas where the S&P 500 has had "consecutive" bullish runs using Heiken Ashi. "14 days" simply means that the S&P 500 has had 14 consecutive days of bullish momentum using Heiken Ashi Candles.
[I only labeled 14 days as the minimum amount of consecutive days.]
Here are some examples
1994 - 1998
2004 - 2008
2010 - 2014
2016 - 2018
2019 - 2021
Present.
Now, back to the overall picture.
The brackets in yellow highlight the time period between the last time the S&P 500 reached its minimum of 14 consecutive days of bullish activity, into the next time it reached its minimum of 14 consecutive days of bullish activity.
Let's refer to this time period as "zero momentum". Notice that during the periods of "zero momentum", it includes the DotCom Bubble, The 2008 Financial Crisis, the market pullback of 2015, the U.S. defaulting on its debt in 2018, and most recently, the drop from 2021 to now.
Below the S&P 500 is the MMRI (turquoise line). During these periods of "zero momentum", the MMRI fell substantially lower. After the period of "zero momentum", the markets went into a real bull cycle. The four instances stated in the paragraph above prove this after the "zero momentum" time period was over.
However, between 2021 into the last two weeks, the period of "zero momentum" has closed...and this time the MMRI has been rising during the "zero momentum" period, instead of falling. The data is suggesting that something is off this time.
If the MMRI falling in the period of "zero momentum" preludes a bullish market, then what is a rising MMRI in this period of "zero momentum" suggesting?!
I think the market is signaling a continuous bear cycle. From 1994 to 2019, these four instances (in the brackets) proved a bull cycle was coming, but now the MMRI is signaling the opposite.
I think a major shift is coming for the markets, but I also do not think the Federal Reserve is done buying debt. I look at a lot of data, and it's obvious by now that the Market is ignoring the data. It's just hoping for more easy money without any kind of structure to support the issuance of easy money.
If for some reason the market does move higher, even after this observation, I believe that at the next period of "zero momentum", the market is going to over correct regardless of whether the Federal Reserve is buying or not. If you look at the time period in the brackets, the MMRI fell with the S&P 500 to find a bottom, then inverted. This time it's doing the opposite.
This observation may also be indicating that the moment of maximum saturation has arrived already, and any major decline in the MMRI will bring the markets down with it. The melting up phase will only exist as long as the MMRI is being propped up.
Great Information. Thank you gentlemen.
Two major factors today that were not relevant decades or even just a few years ago: 1) The Fed's "open and blatant manipulation" and embracing of MMT. 2) Machine algorithm trading was not even in its infancy. Today, 90-95% of all trading is done by machines. Machine learning can only go so far, and it's clear most of the trading is corrupt and not transparent. Bring back fractional stock quotes, bring back the "open cry" pits with options trading, and make insider trading illegal within Congress, and those things could Make America Great Again!
½, ¼, ⅛ and 1/16th's! 😉
Silence DoGood
☕✝️