
Lions and Friends. What Are Your Thoughts On This?
gregorymannarino.substack.com
Lions and Friends. What Are Your Thoughts On This?
From Greg M

Lions and friends.
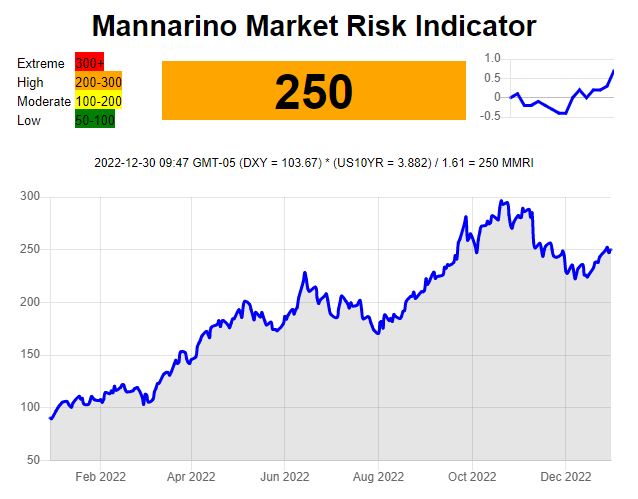
In the video I did this morning, bottom of the page, I explained more about what I am seeing with regard to the global debt/bond market as of late. With that, the MMRI is now sitting at 250- HIGH RISK.
Gauging from your own understanding on all this, and looking at the MMRI chart, where do you see the MMRI in 6 months?
(This is a snapshot of the MMRI below). To see the MMRI in real time, click HERE.
Well we are about to see Gold over 2000 by April and Silver about 30. Lots of bad starting next month and the MMRI 310-320. I would love to see this charted on Tradingview or what exact components we put in there to make a chart. Great work thanks for telling the truth and a financial world full of lies.
Remember when Gregory was pushing PDBC and it went down THIRTY PERCENT? OUCH!!! Guess the MMRI led him astray on that one!!!